 |
| What's Hot! | Products/ Tools | EFI Tuning | Basic Tuning | Advanced Tuning | Chassis Tuning | Advertise with us |
CATEGORIES FOR ARTICLE LINKS BELOW
![]()
DOT Help |
Intercooler Efficiency Test
How intercooler design can changer the performance, efficiency and power of your engine
Contributed by: cp-eTM engineering
The cp-eTM ∆CoreTM intercooler kit is a front mount intercooler upgrade for the BMW N54 engine. It features a 3” thick bar and plate intercooler core good up to 750hp. The kit comes complete with an inline oil cooler kit, all clamps, hoses, brackets, and hardware required for a complete installation.
The following data was collected and processed by cp-eTM, and is an honest representation of the performance of both the factory, and the cp-eTM intercooler. The data was first used to benchmark the factory intercooler, which helped illustrate where room for improvement existed. Once the factory system was well documented and understood, the engineers at cp-eTM went to work creating a high- performance intercooler upgrade for the 1 and 3-series BMWs. Few companies in the country would (or even could) create such a complete document for public consumption, so please enjoy the following detailed analysis of the BMW 1 and 3-series intercooler system.
In order to capture this all of this information we utilized the cp-eTM StandbackTM engine management system in conjunction with our BlackBoxTM logging utility. The BlackBoxTM is actually a telemetry logging system that uses both a 3-dimensional accelerometer and a global satellite positioning system in order to indicate vehicle speed and position over time. The system also features eight analog input channels, which is exactly what we need for our intercooler testing runs. These analog inputs will be populated by a series of temperature and pressure sensors so we can “see” exactly how the intercooler performs under real conditions. (click for larger image)

Because we’re interested in the intercooler efficiency first, we have installed both the temperature and pressure sensors at the inlet and outlet of the intercooler (Figure 1). This avoids any influence in temperature or pressure from the associated piping leading to and from the core. Our goal is to record the temperature and pressure at both the inlet and outlet of the intercooler in order to determine exactly how much cooling it is responsible for, and how much pressure (really kinetic energy) is lost in the process.
TOOLS FOR PROPER INTERCOOLER ANALYSIS:
Testing the performance, let alone measuring the data, is actually a difficult problem for several reasons. First, running an engine this powerful at full throttle long enough to determine anything in regards to the intercooler’s performance would require breaking laws on public roads. To put this in perspective, most of the data we collected was while running in fourth gear, and the runs ended just under 140mph on our dyno! Try doing that on your local back roads (no, not seriously, please don’t)!
Most shops will avoid this speed issue by testing their intercoolers on the dyno, which does make sense. Doing so allows for very precise control of the runs, doesn’t require breaking any laws, and you can even get immediate feedback as to how much power was made after any given run. The problem is that any intercooler’s efficiency is a function of how much air is passing through the front of the core, and most shops don’t have fans big enough to get the requisite air speeds for proper testing. Using fans that are too small for the job simply won't yield any usable data.
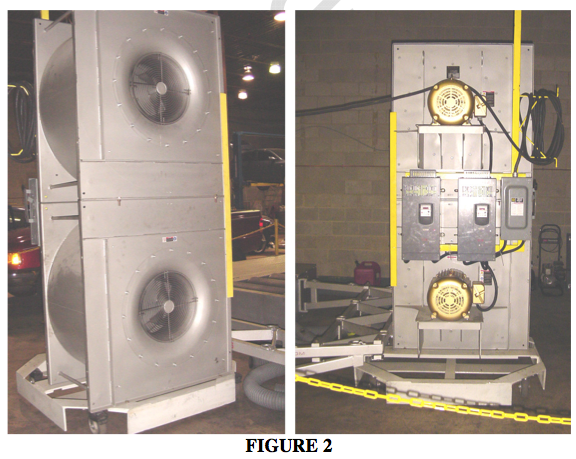
These were non-issues in our case because when we equipped our dynamometer we had intercooler efficiency validation in mind. Our Mustang Dyno model MD500 isn’t so special in and of itself (despite being a fantastic load-bearing dyno), but the fans that were delivered with the unit are (Figure 2). The fans we have are the largest that Mustang Dyno has ever delivered, which are powered by a pair of 15-horsepower brushless electric motors. We’re able to simulate (and have verified using an anemometer) real road wind speeds without leaving our dyno facility. Very few shops in the country can claim the same. Of course, we took the car on the road to verify that our results were in line with what someone might encounter on the road.
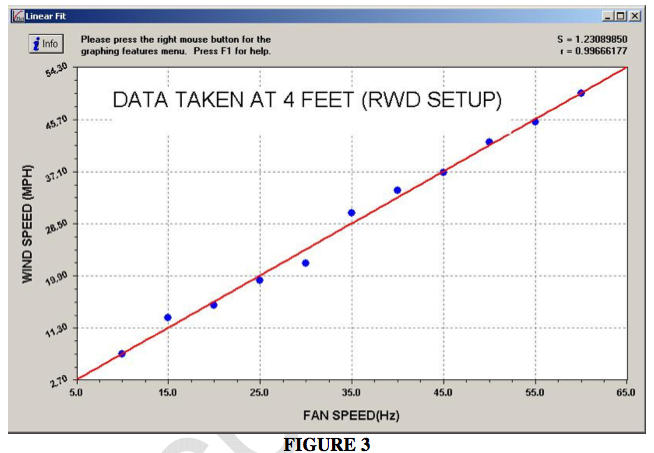
Our fans were more than capable of simulating 50mph wind speeds, which turned out to be more than sufficient. (Figure 3)
The intercooler was tested with the vehicle operating at wide open throttle in fourth gear. Because we’re using a load-bearing dyno we were able to test in only one gear and control exactly how long the engine was loaded for. As you can imagine, unloaded the engine would reach redline much faster under 14psi than it would 8psi, which could skew the results since there wouldn’t be as much time to heat up the core at the higher pressure. So each run was set for precisely ten seconds (as controlled by the dyno brake), which is enough time to properly heat up the turbocharger and intercooler system. Once the sensors were installed on to the factory intercooler we strapped the cp-eTM 1-series down to the dyno.
The factory front mounted intercooler performed well for an OEM component. More precisely, the intercooler performs well when the vehicle is running in factory guise, but starts to struggle as things heat up. When the turbos start creating more boost heat is a natural byproduct, and the factory intercooler starts to struggle as boost increases. Let’s look at a few graphs to illustrate the point.
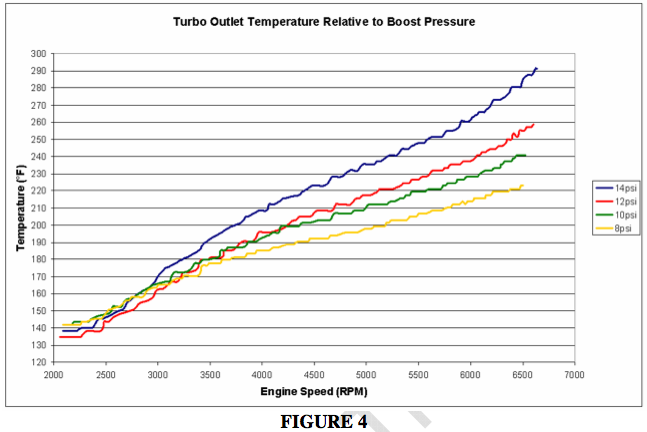
The above graph is illustrating the temperature of the air entering the intercooler (Figure 4). As you can see by the key on the right side of the graph, the 14psi run (the blue line) is the highest, which is what we expect. The more boost we make, the higher the resulting turbo outlet temperature will be. However, when BMW designed the factory intercooler, they probably weren’t anticipating people pumping nearly 50% more air into the intercooler with higher boost pressures. Notice that a 6-pound increase in boost pressure resulted in a temperature increase of over 70°F! This hot air (if left unchecked) can lead to detonation, high exhaust gas temperature, and hurts power production. Okay, so we've looked at the air going into the intercooler, so how well did the factory intercooler cool the air charge?
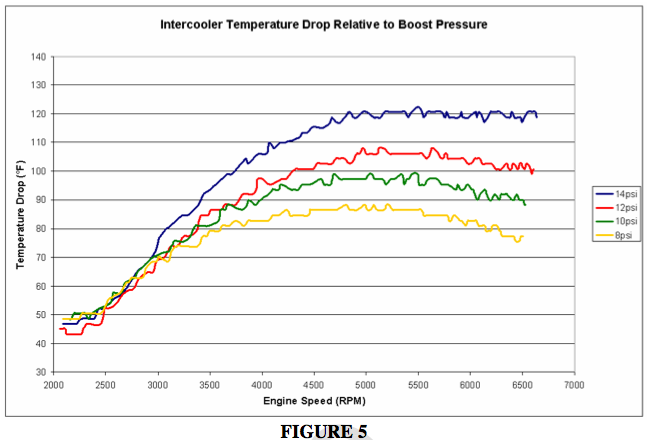
Here’s a graph of the total temperature drop (Figure 5). This is a graph of the inlet air temperature minus the outlet air temperature, or is in other words the total temperature drop relative to engine speed.
Have you ever heard of intercooler manufacturers bragging about their intercooler's incredible temperature drop? Here is an illustration of how misleading that kind of advertising can be without all of the pertinent information! As you can see, the resulting temperature drop increases with boost pressure. This makes sense since the overall drop is a function of the temperature difference between the two fluids passing through the intercooler. In other words, as the difference in temperature between the compressed air charge and the ambient air increases, so does the resulting temperature drop.
So, what’s really important to take away from this data is the total temperature drop while taking note of the boost pressure for each run. If we were selling intercoolers based on temperature drop then we should have waited until the dead of winter and boosted the turbos for all that they’re worth and generated as much heat as possible! But that’s not good science, and it doesn't provide any real meaningful data either. So beware of companies selling intercoolers just based on total temperature drop.
STOCK BOOST PRESSURE LOSS:
Another important factor when evaluating an intercooler is the total pressure drop. What this means is, if you’re running 14psi as indicated by your boost gauge that means the turbos are actually producing something closer to 17psi. This pressure loss is a natural byproduct of flowing air, and the loss will grow as boost pressure increases on any given intercooler core. The trick is designing an intercooler core that is properly sized for the intended application in order to minimize this pressure loss.
Pressure drop essentially comes from two main factors: Internal flow area, and velocity. Regardless of which process is responsible, this pressure drop is a byproduct of a loss of kinetic energy. Airflow loses kinetic energy after sharp bends, or whenever there is a resistance to its forward motion. So things like rough surfaces, physical obstructions, or quick changes in direction can sap energy from the airflow. If an intercooler had zero kinetic energy loss, then the pressure on the inlet, and the outlet of the core would read exactly the same value. Reducing the pressure drop across the core is important because the lower the pressure drop, the less the turbos have to work to hit their intended boost target as measured after the intercooler.
Internal area affects pressure drop because as area increases, so does the available contact surface for the airflow. As discussed above, this puts the flowing air in intimate contact with more intercooler, which removes energy from the air. Air likes to attach itself to walls (or really anything that it’s flowing relative to) and this is called the boundary layer. The boundary layer is a theoretical point of zero velocity, and represents a flow loss to the air passing adjacent to it. When the total surface area of the boundary layer grows, energy is removed from the air, and the total pressure loss grows as well. So, this is just one reason why “bigger” isn't always “better”!
On the other hand, increasing the size of an intercooler can also reduce the resulting pressure drop. The velocity of the air passing through the inside of the core is a function of the volume of air flowing and the passage cross-sectional area, and fluid friction is a function of velocity. So, if the cross sectional area increases and airflow velocity drops; then so does the friction generated and the resulting pressure drop. So there's definitely a balancing act one has to play when sizing an intercooler core for a specific application. If the internal cross-sectional area of an intercooler is fixed, then increasing the airflow (by turning up boost, or revving higher for instance) will increase velocity, which increases the associated pressure drop. Let’s look at some charts to see how this actually holds in practice.
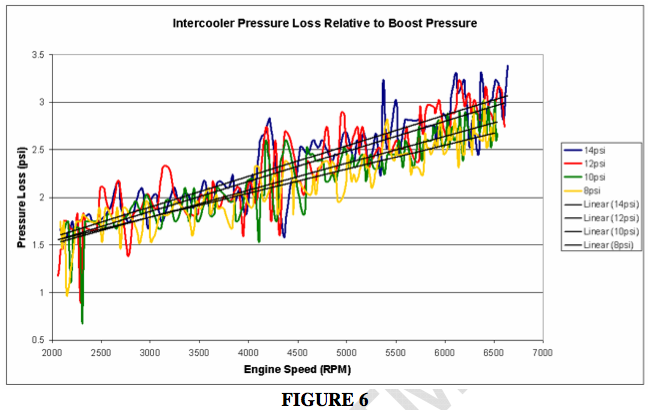
The chart above is illustrating the difference in pressure between the inlet, and outlet of the stock intercooler. So this is the total pressure drop across the intercooler core. If the intercooler had no pressure drop at all (which is physically impossible), then both the inlet and outlet pressure sensors would read the same value, and the chart would indicate “0psi” everywhere. However, this is reality, and as such they’re measuring a pressure loss across the core. So for instance, if the graph indicates “3psi” in some region, and the boost gauge in your car is indicating “12psi” at that same point in time, this means that your turbos are actually producing 15psi before the air enters the intercooler. So your turbos are compressing an extra 3psi of boost that your engine never even sees.
Now, the data is pretty noisy; but what is important, are the trends. So what I’ve done is added a trend line to the traces to illustrate what the trend is. As you can see, increasing the pressure certainly did increase the associated pressure drop. This is because we’re trying to force more air through the same cross-section, which increases velocity and the resulting pressure drop. Take note of the maximum flow loss (~3psi); as this will be compared to the cp-eTM intercooler later in the paper.
STOCK INTERCOOLER EFFICIENCY:
So we have looked at a few graphs, but we really haven’t quantified how capable the factory intercooler is. If loud-mouth Joe Blow tells me that his intercooler is better than mine, how can we really determine which is better with so many variables? The answer is an intercooler efficiency equation, mentioned in the beginning of this paper, which takes ambient temperature, inlet, and outlet temperature into consideration when evaluating the performance of any heat exchanger.
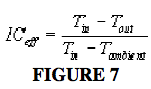
Above is the equation we can use to quantify intercooler efficiency (Figure 7). Looking at the equation, you can clearly see that a higher temperature drop (Tin - Tout) is going to increase the calculated efficiency, but there’s more to the equation. The bottom of the equation (Tin – Tambient) takes ambient temperature into account because obviously if the air outside is colder, then the intercooler is going to transfer more heat to the cooling fluid, which increases the intercooler’s calculated efficiency. So this equation does a good job at leveling the playing field for varying ambient temperatures. That way, performing these tests in the dead of winter, or desert heat won't appreciably skew our results.
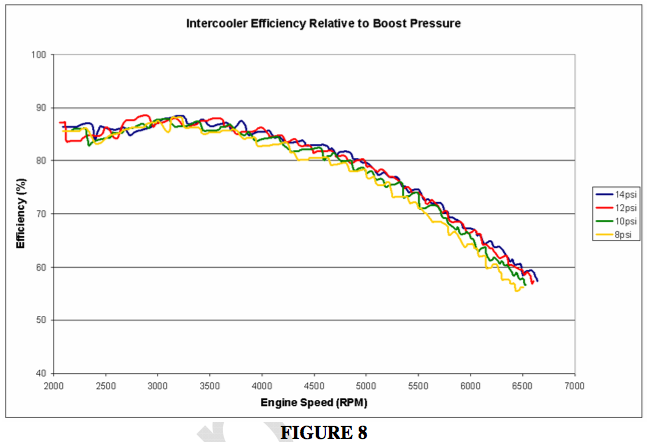
Instead of going through the calculations for each data point I’ve imported the information into a spreadsheet and graphed the intercooler efficiency function. This graph illustrates how the intercooler deals with heat over time. 100% would indicate that the intercooler cooled the compressed air all the way down to the ambient air temperature, and 0% would mean no cooling took place at all. As you can see as boost comes on and the temperature increases the efficiency increases, but eventually reaches a point where the heat coming in exceeds the heat going out, and efficiency suffers. Because the efficiency of the intercooler changes over the engine speed range, we’ll take the last (or worst) value, which in this case is about 58%.
cp-eTM ∆CoreTM FRONT MOUNT INTERCOOLER
Now that we know how the factory intercooler performs we can make educated decisions as to how to design a higher capacity intercooler. Ideally we’d like to create a core that has a higher thermal efficiency and a lower pressure drop than the factory core, but is that possible? How does one increase intercooler efficiency and drop the overall pressure loss at the same time?
Increasing cooling efficiency is the easy part. If we increase the size of the intercooler then the intercooler’s ability to reject heat increases. But we also discussed earlier that an increase in intercooler size is often times met with an increase in pressure drop. The trick here is optimizing the internal flow area of the intercooler. Remember that velocity plays a big role in the associated pressure drop, as the difference in pressure loss between running 8psi and 14psi was just about 1:2 in our OEM intercooler testing. Increasing the internal flow area will increase the available area for a boundary layer, which increases friction, but it will reduce the velocity of the air which also reduces friction and the associated pressure loss.
Also important is the end tank design. Any abrupt changes in direction or sharp corners are going to increase pressure losses due to flow separation, and should be avoided. When air changes direction too quickly the boundary layer separates from the wall and effectively reduces the overall flow area available. So we can help reduce unnecessary pressure loss by paying attention to how the air is directed from the inlet pipe and into the intercooler. Some end tanks are fabricated and welded using sheet metal, and others are cast aluminum. So which is better? The answer is neither really, and actually comes down to how well the end tanks are constructed (do they incorporate a quality weld or casting?), and their shape. Most important is that the end tanks gently routes the airflow into and out from the intercooler core (i.e. crates a gentle 90° bend into the core itself). Castings are generally better at producing slow sweeping shapes for end tanks, but that isn’t to say that fabricated end tanks are necessarily inferior either. We eventually decided to upon a 4”x 6”x 22” intercooler core for our N54 FMIC. The dimensions for the cp-eTM intercooler were primarily dictated by the available work area, since the enclosure for the intercooler in the front of the car is very tight. We wanted to increase the size of the intercooler as much as possible without requiring a large amount of cutting or trimming to the vehicle, and we also didn’t want to place intercooler core in areas of dead airflow. The 4”x6”x22” core fit our work area perfectly (requiring very minor trimming), it receives flow across the entire frontal area, and it should provide a nice increase in cooling capacity over stock intercooler. So how did it fare? First, let’s look at an intercooler inlet temperature graph.
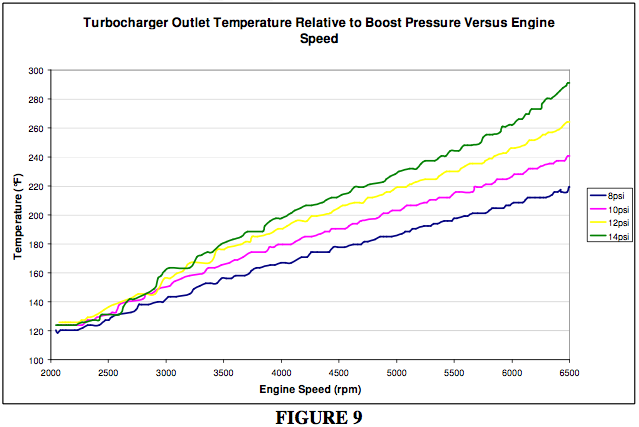
Above is a chart of the intercooler inlet temperatures for the varying boost pressure levels (Figure 9). As you can see, the new intercooler didn’t have much effect on turbocharger efficiency, and now that we see the intercooler inlet temperature is almost identical to the OEM intercooler runs, what was the resulting temperature drop like?
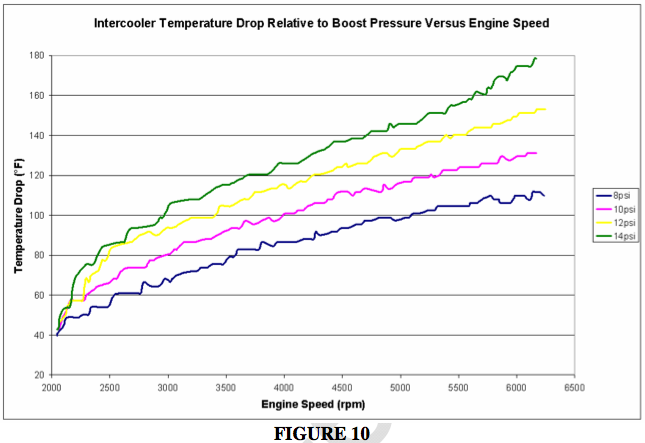
The resulting temperature drop is nothing short of extraordinary, and illustrates how much room for improvement there really is over the factory intercooler (Figure 10). Whereas the factory intercooler was barely able to muster a 120°F temperature drop at 14psi, the cp-eTM intercooler nearly hit a 180°F drop under exactly the same conditions, and it looks like it was still climbing, which means that it had not reached its heat rejection limit. As you can imagine, such a dramatic increase in temperature drop with little change in inlet temperature is going to greatly affect the calculated efficiency for the intercooler, and it did.
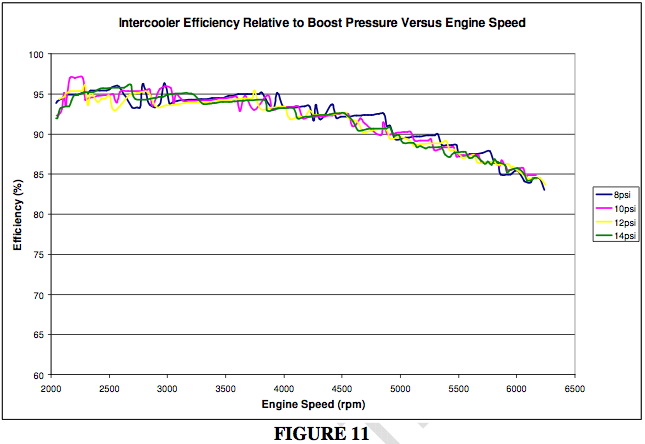
8psi 10psi 12psi 14psi The chart above illustrates the intercooler efficiency during a fourth gear run on the dyno (Figure 11). The ultra-high efficiency numbers towards the beginning of the run (>90%) is likely due to the intercooler core heating up initially, and shouldn’t be paid much attention. Since most people won’t be running with a cold intercooler core, the numbers after 5000rpm are a much better indicator of the intercooler’s performance under real-world conditions. The same can be said with the stock intercooler; however it heats up much quicker since it has less thermal mass. If you take the final (or worst) number as the core’s efficiency rating, the cp-eTM intercooler managed an 83% efficiency rating. Notice we could technically say that our intercooler is 95% efficient, but again that isn't really a relative portion of the test, and is somewhat misleading. Beware of unusually high sounding efficiency claims! If it sounds too good to be true, more often than not, it is. What’s amazing is that despite this dramatic increase in thermal efficiency, there was actually a drop in the associated pressure loss. We can assume this is due to a drop in flow velocity through the intercooler core, which likely more than offset the increase in the total cross-sectional flow area.
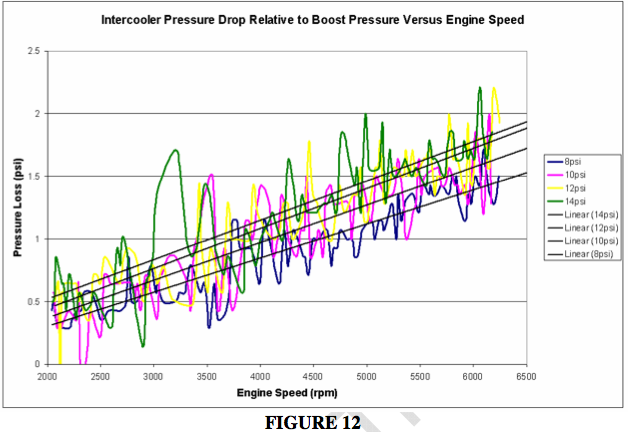
If you follow the trend line for the 14psi run you can see that it would hit 2psi by about 7000rpm if we extrapolate that data out a little further (Figure 12). Looking back at the chart for the OEM intercooler, the cp-eTM intercooler dropped the pressure loss by about 1psi, which although modest, it does decrease impeller speed to some degree, which is good for turbo longevity.
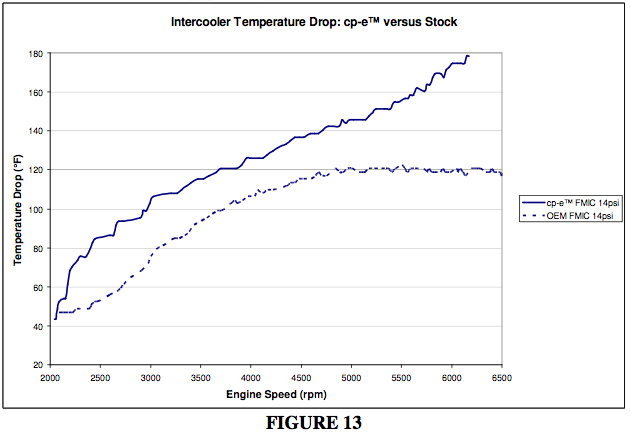
Here are some graphs of the factory and cp-eTM intercooler overlaid on top of each other so you can directly compare the performance of each intercooler. In the chart above the cp-eTM intercooler is always cooling better than the stock unit, but it isn’t until after 4500rpm when the cp-eTM intercooler really starts to shine (Figure 13).
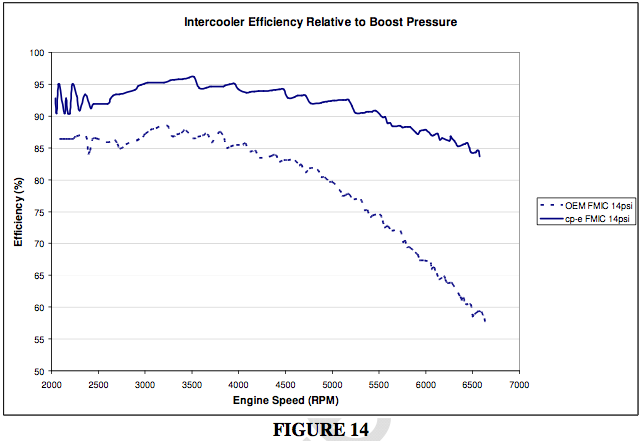
Here is a graph of the OEM and cp-eTM intercooler’s thermal efficiency during a 4th gear dyno pull (Figure 14). Again, the same trend can be seen: Below 4500rpm the cp-eTM intercooler yields a slight cooling advantage, but after 4500rpm the curves diverge and the difference in cooling performance becomes substantial. As you can imagine, the performance difference between the two cores will almost undoubtedly result in a healthy power gain in the top half of the powerband.
EXTRACTING “FREE” HORSEPOWER:
Dyno testing any intercooler setup is tricky for most because as was said earlier, very few shops in the country have the requisite equipment for proper intercooler validation testing. We however have fans that are large enough to simulate wind speeds one might encounter on the road so we put the two intercoolers up against each other to see if we could measure any performance advantage with the cp-eTM core.
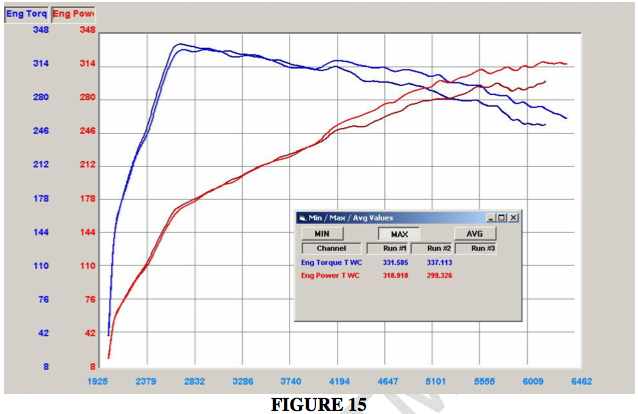
As expected we picked up just under 20whp at our power peak, and gained very little below 4000rpm (Figure 15). It is also interesting to note how well our empirical temperature data agreed with our dyno data. The cp-eTM intercooler really started to shine over the stock intercooler after 4000rpm, which is exactly where we found hidden power that was previously lost to heat.
Making more power with an intercooler isn’t the only advantage a better performing core can offer either. A well designed intercooler will help prevent engine knock, and can also keep engine coolant and oil temperatures down.
SUMMARY:
cp-eTM set out to create an upgraded intercooler for the N54 powertrain that not only increases thermal efficiency, but also reduces the pressure drop along the intercooler core. In the end we improved thermal efficiency by nearly 25%, improved the pressure drop along the core by 33%, and in the end the cp-eTM intercooler was responsible for freeing up about 20 horsepower as measured at the wheels. I think it’s safe to say that Custom Performance Engineering has developed a serious intercooler from serious engineering.
Everyone is going to have different goals and different limitations when modifying their vehicles. We've created what we believe to be the best bolt-on intercooler system for the BMW 1 and 3-series vehicles, but there's no such thing as “one size fits all.” Determine first what your goals are for your vehicle, and if our intercooler isn't the right solution for your project, use this guide as a resource for shopping for your next intercooler. That way, the next time Slick tells you that his intercooler is 95% efficient and has a 0.1psi pressure drop, now you've got some tough questions for him to answer.For any questions regarding the cp-eTM intercooler kit, please call us at our office, 301-576-6142, or visit our website, www.cp-e.com.
Enginebasics.com would like to thank cp-e for providing real data and doing real tests for automotive enthusiasts. We would ask that you support companies like cp-e who are paving the way for better engineering and parts for vehicles. .pdf file
ATTENTION READER:
If you enjoyed the information and article you just read be sure to check out our newly released book with even more exciting photo's and information:How to Turbocharge and Tune your Engine
Want to know more about your particular Make and Model vehicle? All of these vehicles are covered in the tech, maintenance and repair articles found above. Enginebasics is the wiki or wikipedia of car part, repair, how to and tuning information. Let us be the class 101 for your automotive learning.
| Ford | General Motors GM | Pontiac | Jaguar | Land Rover | Nissan |
| Toyota | Honda | Lexus | Acura | Lotus | Scion |
| Infinity | BMW | Mercedes | Mitsubishi | Ferrari | Maserati |
| Lamborghini | Volks Wagen VW | Saab | Audi | Hyundai | Kia |
| Subaru | Mazda | Chevy | Volvo | Caddilac | Dodge |
| Chrylser | Daewoo | Porsche | Mercury | Freightliner | MG |
Individual Models
| Ford Mustang | Mitsubishi Eclipse | Mitsubishi Evo | Subaru WRX / STI | Dodge Viper | Chevrolet Corvette |
| Nissan Skyline | Honda S2000 | Nissan 350z | Toyota Supra | Chevy Camaro | Lotus Elise Exige |
| Honda Civic | VW Golf | Dodge SRT-4 | Eagle Talon | Acura Integra | BMW M3 |
| Nissan 240sx | Porsche 911 | Acura NSX | Honda Accord | Toyota Camry | Toyota MR2 |
| VW R32 | Dodge Truck | Mazda Rx7 | VW Jetta | Sand Buggy | Nissan Sentra |
For the latest Automotive news and stories visit the websites below |


Our feature Build: An AWD V6 Civic